

Simple linear regression (SLR) - simplified

Most of the learning materials on machine learning are overly complex and use too much math from start in my opinion. In this post, I will try to simply explain what simple linear regression is. This will require a few mathematical terms, but I will keep it as just one simple formula. Mathematical details behind it, I will explain in some other post. So, let's first start with a definition.
Definition: Linear regression is a model in which we assume a linear relationship between input variables and output.
Unless you at least took some college-level linear algebra, that definition might be confusing. So, let’s try to simplify it. And let's use simple linear regression for that.
In simple linear regression, we are predicting value based on one input, for example, the price of a house based on size. Because it is linear regression, we are expecting to get the following equation which we could use for our prediction:
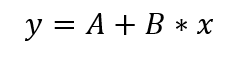
In this equation y would be the price we are trying to predict, x would be the size of the house we are using as an input value, and A and B are coefficients that define our model. There is a mathematical process to define values for those coefficients and there are libraries that do that for us, but once again, that is not a goal of this post and will be explained in the next one.
Now, for the reason why it is called linear regression. If we would generate a chart visualizing this function, we would get a straight line like in the chart below.
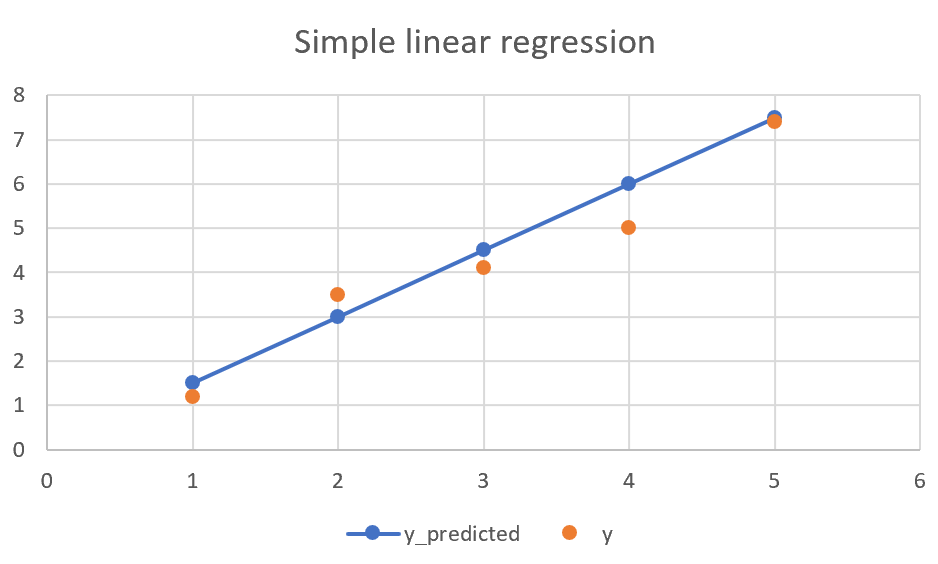
In the chart above, orange points are actual values, while blue ones are predicted ones. As we can see, some are better fitting than others, but that is fine. We are trying to get a model that would fit our data best, but not perfect. If we would try to fit every point, the function would be much more complex than this, not a straight line, and it would perform poorly on new and unseen data.
The question is what line would describe it best. There actually is the definition for that. For every value of training data that we used to generate the model, we sum differences of predicted and actual values. The function where this sum is smallest is one that gives the best model.
Hopefully, this gives a simple view of what simple linear regression is. It is a simple model that can be used wherever data could be approximated with a line. In the next post, I will explain how to use python and different libraries to make predictions and the mathematical background behind generating models.
For more, you can follow me on Twitter, LinkedIn, GitHub, or Instagram.


